
AFM calls for a European set of capital market data
The developments in the European capital markets increasingly require an integrated, European supervisory strategy. For instance, equity markets have become the domain of ultrafast international algorithmic trading, and while corporate funding through European fixed income markets is picking up, it still relies heavily on banks. In addition, volatility in the European energy market could easily rear its head again.
Today, the AFM publishes the ‘State of the Capital Markets’ report for the second time. The first time the AFM published this overview of Dutch capital markets was in 2022. The graphs and tables in this report provide a multi-annual overview of the developments and trends in the Dutch equity markets, fixed income markets and commodity markets.
Hanzo van Beusekom, AFM executive board member: ‘A centralised EU set of capital market data is high on our list of priorities. This will, for example, help identify potential financial risks and cross-border market abuse at an earlier stage. After all, most participants in European capital markets operate internationally. In addition, a national set of high-quality data, as reflected in our report, of course continues to be imperative to keep our data-driven supervision of Dutch capital markets in focus and to improve it.’
Explanation of the visual
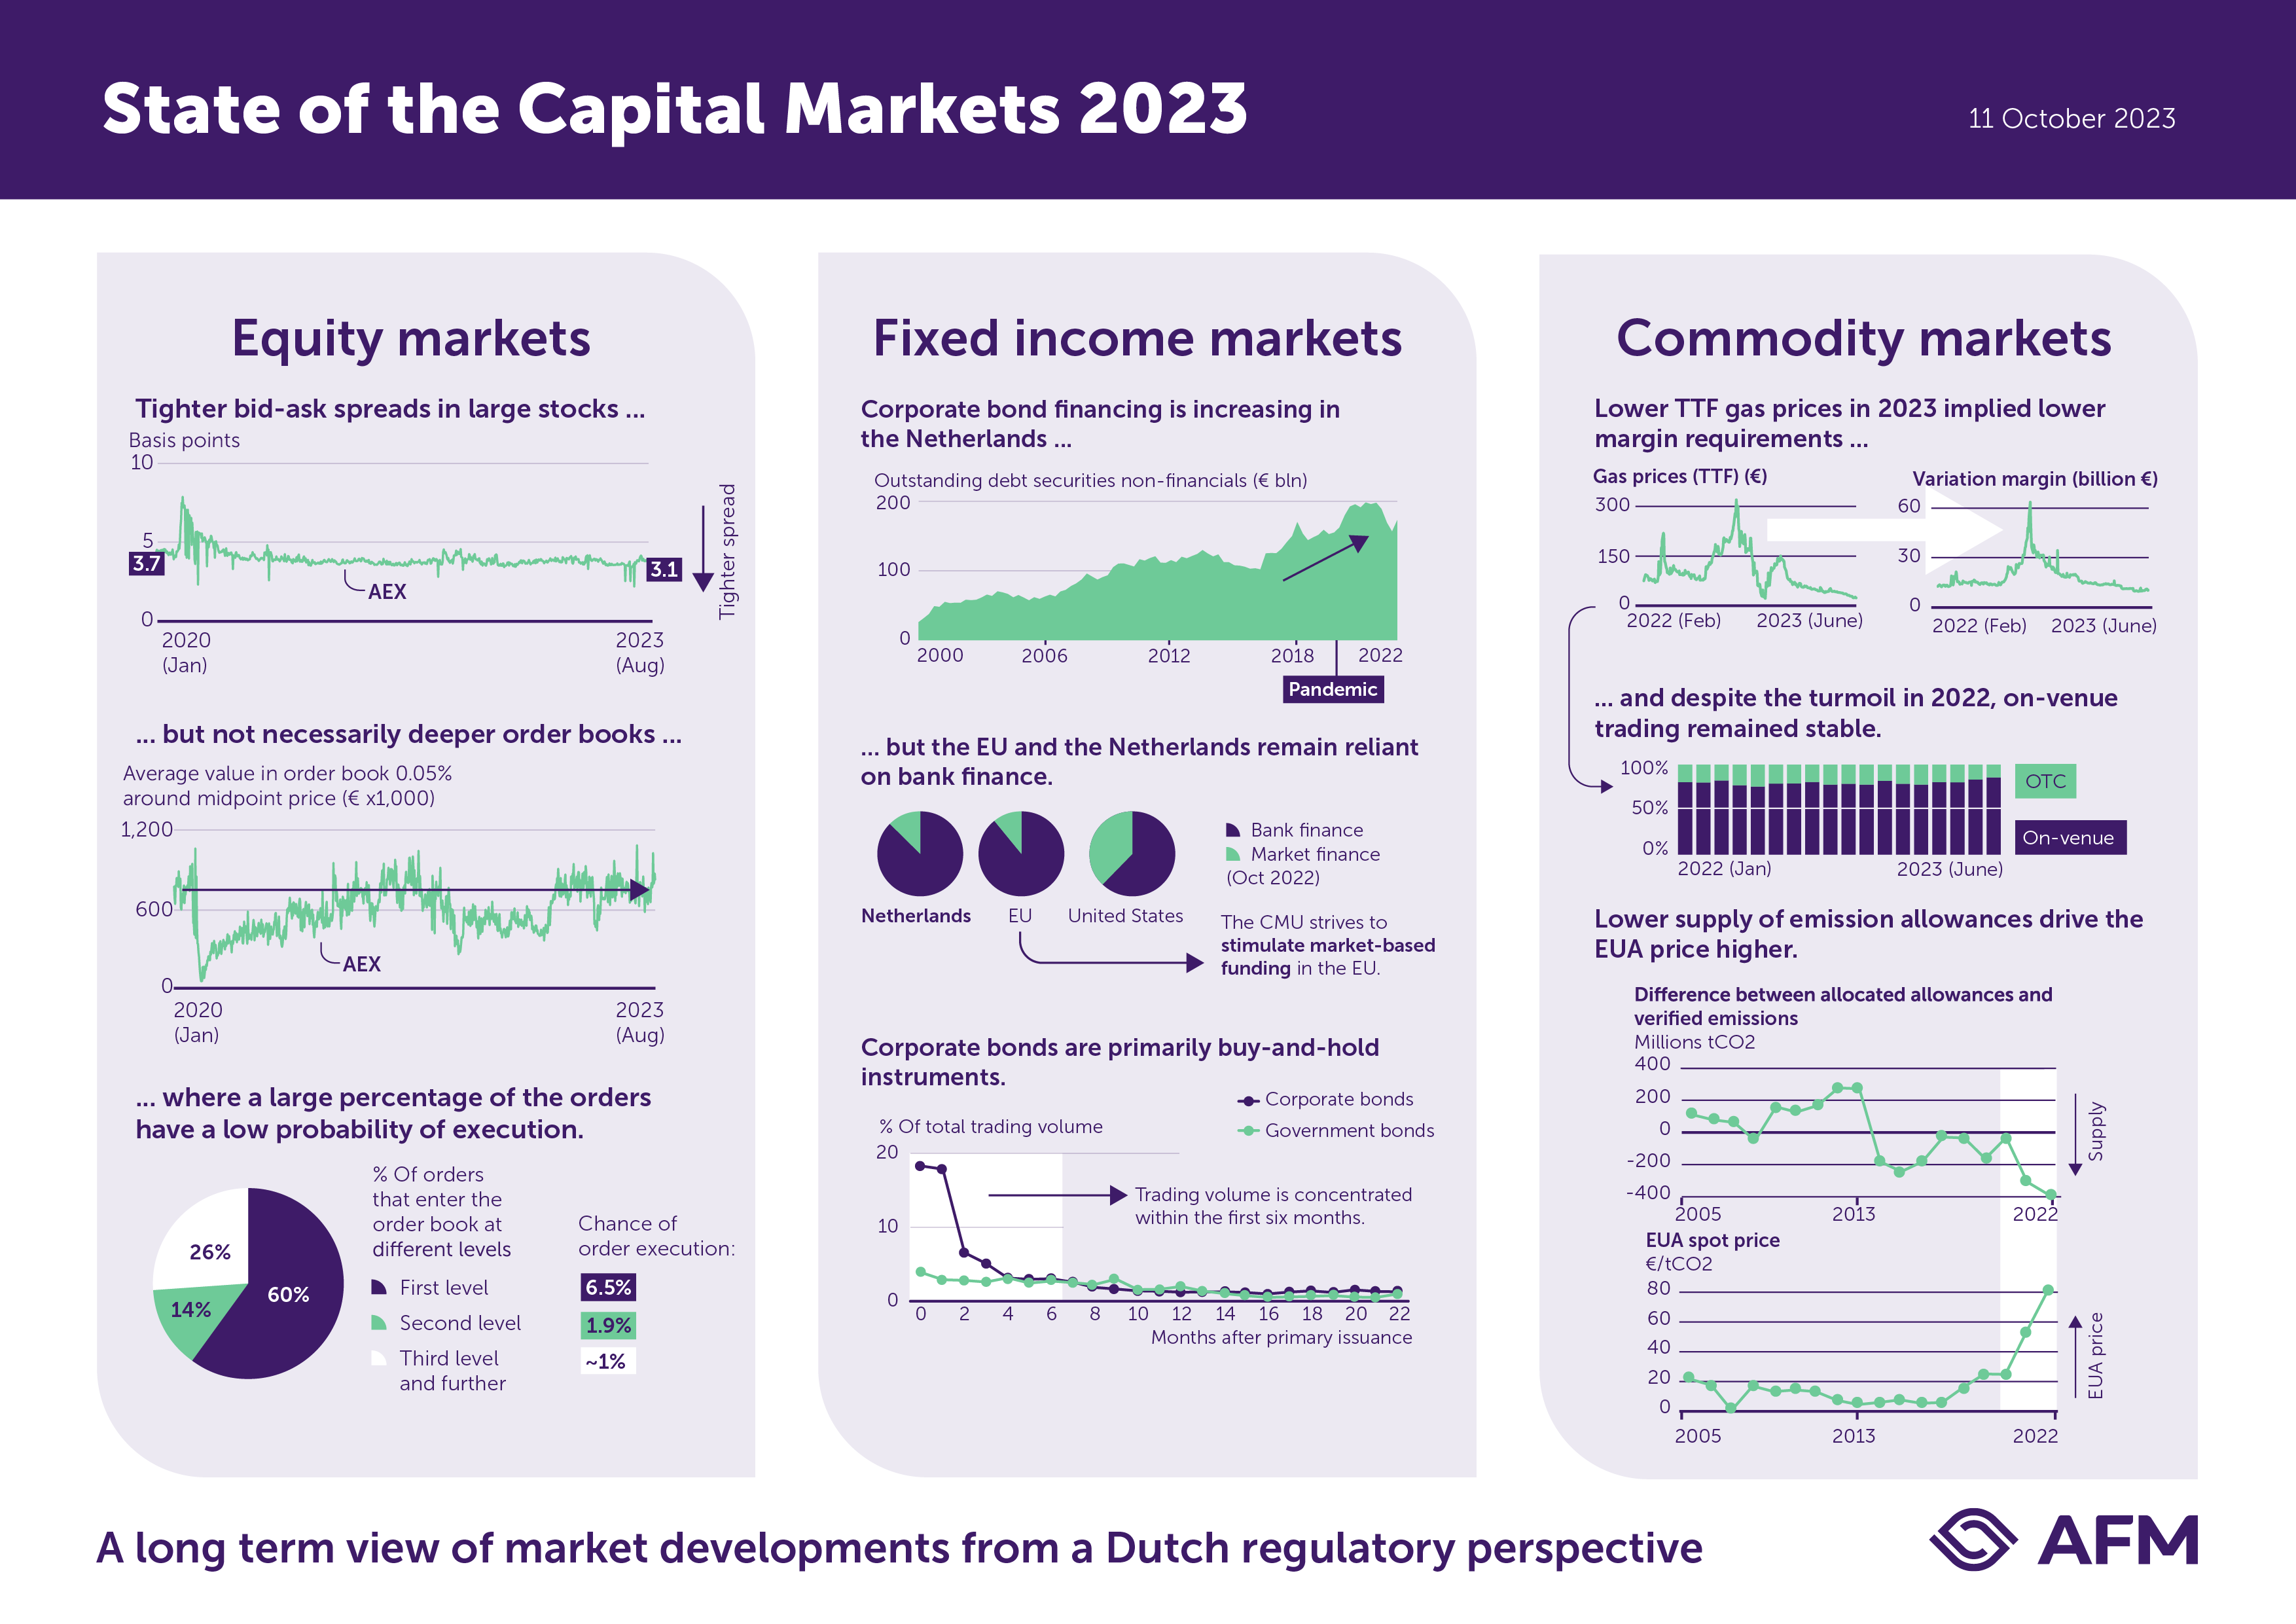
In this visual we show graphs that demonstrate the state of the capital markets in 2023.
Equity markets
Figure 1: This graph shows tighter bid-ask spreads in large stocks, in basis points of the AEX from Jan 2022 – Aug 2023.
Figure 2: However, the average value in order book 0.05% around midpoint price, from Jan 2022 – Aug 2023, does not show that order books have become deeper.
Figure 3: A large percentage of the orders have a low probability of execution. The graph shows that, for example, 60% of all orders enter at the first level in the order book, of which only 6.5% is executed.
Fixed income markets
Figure 1: Corporate bond financing is increasing in The Netherlands, as shown in the outstanding debt securities of non-financials (in billion euro’s) between 2000-2022.
Figure 2: However, the EU and The Netherlands remain reliant on bank finance, with a share of approximately 80%, as shown in two pie charts. The CMU strives to stimulate market-based funding in the EU. The US shows a larger share of market-based funding than the EU and the Netherlands.
Figure 3. Corporate bonds are primarily buy-and-hold instruments. The graph shows that their trading volume is concentrated in the first six months.
Commodity markets.
Figure 1. Lower TTF gas prices in 2023 implied lower margin requirements. The two graphs show gas prices (TTF) in euro’s from Feb 2022-June 2023 and variation margin (billion euro’s) in the same period.
Figure 2. Despite the turmoil in 2022, on-venue trading remained stable. The graph shows a stable share of OTC (around 25%) and on-venue (around 75%) from Jan 2022-June 2023.
Figure 3. Lower supply of emission allowances drives the EUA price higher. The first graph shows the decreasing difference between allocated allowances and verified emissions in millions of tCO2, from 2005-2022 (supply). The second graph shows an increase of the EUA spot price in euro’s per tCO2 in the same period.
Tags
Information for AIFM and collective investment schemes Investment firms Securities issuers Trading and settlement platformsWould you like to receive the latest news from AFM?
Subscribe to our newsletter, we will keep you up-to-date.